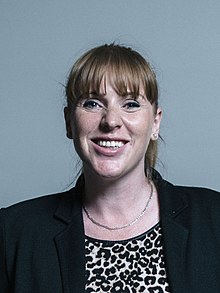
Mrs Louise Ellman – 2016 Parliamentary Question to the Department for Transport
The below Parliamentary question was asked by Mrs Louise Ellman on 2016-01-15.
To ask the Secretary of State for Transport, how many vehicles (a) underwent and (b) failed in-service emissions tests conducted by the (i) Vehicle Certification Agency and (ii) Driver and Vehicle Standards Agency in each of the last 10 years.
Andrew Jones
The figures below show how many vehicles and models the VCA has tested for in-service emissions and those that failed those in-service emissions tests.
|
(a) Number of vehicles tested (figures in brackets are the number of models tested) |
(b) Number of vehicles failed-in service emissions (figures in brackets are the number of model failures) |
|
|
2005 / 2006 |
38 (13) |
18 (1) |
|
2006 / 2007 |
35 (8) |
17 (0) |
|
2007 / 2008 |
35 (10) |
7 (0) |
|
2008 / 2009 |
45 (10) |
21 (1) |
|
2009 / 2010 |
44 (10) |
17 (0) |
|
2010 / 2011 |
30 (10) |
7 (0) |
Overall from 2005/06 to 2010/11, 227 individual tests were completed (76 Petrol, 151 Diesel) and 87 vehicles failed to achieve a pass for all pollutants (14 Petrol, 73 Diesel).However, it should be noted that the pass / fail criteria involved a statistical process looking at the average of the vehicle tests carried out. This generally involved a minimum of 3 tests, but any individual failures resulted in more vehicles being tested. Using this process, there were 2 Model Failures (1 Petrol and 1 Diesel).
Following the work in 2010-2011, the focus of the VCA’s emissions testing changed to consider aftermarket alteration of vehicles, both light and heavy duty.
The figures below show how many vehicles the Driver and Vehicle Standards Agency (DVSA) has tested and those that failed in-service emissions tests. In-service emissions testing is interpreted to refer to emissions testing through the MOT service. DVSA does not hold figures for 2005/06.
Car and light Goods vehicles up to 3000kg – DVSA
|
Financial Year |
Tests |
Emission Failures |
|
2006/07 |
26,299,000 |
771,696 |
|
2007/08 |
24,912,548 |
809,498 |
|
2008/09 |
25,537,682 |
791,818 |
|
2009/10 |
26,047,520 |
766,371 |
|
2010/11 |
26,637,490 |
734,246 |
|
2011/12 |
26,827,367 |
710,877 |
|
2012/13 |
26,872,425 |
656,279 |
|
2013/14 |
27,481,013 |
641,477 |
|
2014/15 |
27,669,148 |
607,400 |
Light goods vehicles between 3000 up to 3500kg – DVSA
|
Financial Year |
Tests |
Emission Failures |
|
2006/07 |
522,875 |
11,902 |
|
2007/08 |
520,682 |
11,329 |
|
2008/09 |
541,307 |
10,415 |
|
2009/10 |
563,829 |
9,424 |
|
2010/11 |
602,080 |
8,702 |
|
2011/12 |
608,144 |
8,965 |
|
2012/13 |
587,779 |
7,731 |
|
2013/14 |
601,942 |
8,004 |
|
2014/15 |
616,126 |
8,308 |


