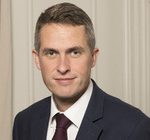
Part of the constituency archive.
IPSWICH
11 Apr 1660 – Nathaniel Bacon 12 Dec 1593 Aug 1660 66 Francis Bacon (to 1661) (30 Sep 1600 – c. Sep 1663) aged 62
29 Oct 1660 – Sir Frederick Cornwallis,1st baronet,later [1661] 1st Baron Cornwallis (14 Mar 1611 – 7 Jan 1662) aged 50
17 Apr 1661 – John Sicklemore c 1612 mid 1670 William Blois (to 1674) (7 Jul 1600 – 13 Nov 1673) aged 73
9 Nov 1670 – John Wright (to 1685) (9 Apr 1615 – 29 Nov 1683) aged 68
22 Jan 1674 – Gilbert Lindfield (? – 1680)
14 Dec 1680 – Sir John Barker,4th baronet (to 1696) (c. 1655 – 14 Aug 1696)
16 Mar 1685 – Sir Nicholas Bacon (c. 1622 – 1687)
12 Jan 1689 – Peyton Ventris (Nov 1645 – 6 Apr 1691) aged 45
28 May 1689 – Sir Charles Blois, 1st baronet (14 Sep 1657 – 10 Apr 1738) aged 80
31 Oct 1695 – Charles Whitaker (to 1698) (c. 1642 – 19 Jun 1715)
10 Nov 1696 – Richard Philips (to Jan 1701) (c. 1640 – 8 Jan 1720)
26 Jul 1698 – Samuel Barnardiston,later [1707] 2nd baronet – (28 Jan 1660 – 3 Jan 1710) aged 49
9 Jan 1701 – Joseph Martin [kt 1712] (c. 1649 – 16 Aug 1729)
9 Jan 1701 – Sir Charles Duncombe (16 Nov 1648 – 9 Apr 1711) aged 62
9 Dec 1701 – Charles Whitaker (to 1705) (c. 1642 – 19 Jun 1715)
9 Dec 1701 – Richard Philips (c. 1640 – 8 Jan 1720)
29 Jul 1702 – John Bence (to 1708) (27 Sep 1670 – 18 Oct 1718) aged 48
11 May 1705 – Henry Poley (5 Jan 1654 – 7 Aug 1707) aged 53
21 Nov 1707 – William Churchill (to 1714) (11 Aug 1661 – Feb 1737) aged 75
6 May 1708 – Sir William Barker, 5th baronet (c. 1685 – 23 Jul 1731)
3 Sep 1713 – William Thompson (c. 1676 – 27 Oct 1739)
[Both sitting members (Churchill and Thompson) were unseated on petition in favour of Richard Richardson and Orlando Bridgeman 1 Apr 1714]
1 Apr 1714 – Richard Richardson (c. 1664 – 31 Dec 1714)
1 Apr 1714 – Orlando Bridgeman (22 Jun 1680 – 24 Apr 1731) aged 50
28 Jan 1715 – William Thompson [kt Jul 1715] (to 1730) (c. 1676 – 27 Oct 1739)
28 Jan 1715 – William Churchill (11 Aug 1661 – Feb 1737) aged 75
13 Dec 1717 – Francis Negus (to 1733) (3 May 1670 – 9 Sep 1732) aged 62
27 Jan 1730 – Philip Broke (to 1734) (1702 – 21 Sep 1762) aged 60
19 Jan 1733 – William Wollaston (to 1741) (26 Apr 1693 – 20 Jun 1757) aged 64
25 Apr 1734 – Samuel Kent (to 1759) (c. 1683 – 8 Oct 1759)
8 May 1741 – Edward Vernon (12 Nov 1684 – 30 Oct 1757) aged 72
7 Dec 1757 – Thomas Staunton (to 1784) (13 Mar 1707 – 1 Oct 1784) aged 77
20 Nov 1759 – George Montgomerie (30 Aug 1712 – 26 Mar 1766) aged 53
27 Mar 1761 – Francis Vernon, later [1762] 1st Baron Orwell [I] and [1777] 1st Earl of Shipbrook [I] (c. 1715 – 15 Oct 1783)
16 Mar 1768 – William Wollaston (Feb 1731 – 10 Nov 1797) aged 66
3 Apr 1784 – William Fowle Middleton,later [1804] 1st baronet (8 Nov 1748 – 26 Dec 1829) aged 81 (to 1790)
3 Apr 1784 – John Cator – (12 Mar 1728 – 21 Feb 1806) aged 77
[his election was declared void 18 Jun 1784]
25 Jun 1784 – Charles Alexander Crickett (to 1803) (12 Jan 1736 – 16 Jan 1803) aged 67
18 Jun 1790 – Sir John Hadley D’Oyly, 6th baronet (Jan 1754 – 5 Jan 1818) aged 63
28 May 1796 – Sir Andrew Snape Hamond,1st baronet (28 Dec 1738 – 12 Oct 1828) aged 89 (to 1806)
8 Feb 1803 – William Fowle Middleton,later [1804] 1st baronet (8 Nov 1748 – 26 Dec 1829) aged 81
29 Oct 1806 – Richard Wilson 5 Oct 1759 7 Jun 1834 74 Robert Stopford [kt 1815] (5 Feb 1768 – 25 Jun 1847) aged 79
6 May 1807 – Home Riggs Popham [kt 1815] 12 Oct 1762 11 Sep 1820 57 Robert Alexander Crickett (to Jun 1820) (1784 – 3 Jan 1832) aged 47
[following the general election in Apr 1820, his name was erased from the return and that of Thomas Barrett-Leonard substituted 14 Jun 1820]
5 Oct 1812 – John Round (8 Mar 1783 – 28 Apr 1860) aged 77
4 Jul 1818 – William Newton (c.1783 – 4 Nov 1862)
14 Apr 1820 – William Haldimand (to 1827) (9 Sep 1784 – 20 Sep 1862) aged 78
14 Jun 1820 – Thomas Barrett-Lennard (4 Oct 1788 – 9 Jun 1856) aged 67
17 Jun 1826 – Robert Torrens (1780 – 27 May 1864) aged 83
[the names of the sitting members (Haldimand and Torrens) were erased from the return and those of Robert Adam Dundas and Charles Mackinnon substituted 23 Feb 1827]
23 Feb 1827 – Robert Adam Dundas (Christopher 1836-1855, then Nisbet-Hamilton) (9 Feb 1804 – 9 Jun 1877) aged 73
23 Feb 1827 – Charles Mackinnon (1773 – 19 Oct 1833) aged 60
4 May 1831 – James Morrison (6 Sep 1789 – 30 Oct 1857) aged 68
4 May 1831 – Rigby Wason (12 Apr 1797 – 24 Jul 1875) aged 78
8 Jan 1835 – Fitzroy Kelly [kt 1845] (1 Oct 1796 – 18 Sep 1880) aged 83
8 Jan 1835 – Robert Adam Dundas (Christopher 1836-1855, then Nisbet-Hamilton) (9 Feb 1804 – 9 Jun 1877) aged 73
Election declared void 9 Jun 1835
19 Jun 1835 – James Morrison (6 Sep 1789 – 30 Oct 1857) aged 68
19 Jun 1835 – Rigby Wason (12 Apr 1797 – 24 Jul 1875) aged 78
27 Jul 1837 – Thomas Milner Gibson (to 1839) (3 Sep 1806 – 25 Feb 1884) aged 77
27 Jul 1937 – Henry Tufnell – (1805 – 15 Jun 1854) aged 48
[he was unseated on petition in favour of Fitzroy Kelly 26 Feb 1838]
26 Feb 1838 – Fitzroy Kelly [kt 1845] (to 1841) (1 Oct 1796 – 18 Sep 1880) aged 83
15 Jul 1839 – Sir Thomas John Cochrane (5 Feb 1789 – 19 Oct 1872) aged 83
3 Jul 1841 – Rigby Wason (12 Apr 1797 – 24 Jul 1875) aged 78
3 Jul 1841 – George Rennie (1802 – 22 Mar 1860) aged 57
Election declared void 25 Apr 1842
3 Jun 1842 – Otway O’Connor Cuffe,3rd Earl of Desart [I] 12 Oct 1818 1 Apr 1865 46 Thomas Gladstone,later [1851] 2nd baronet (25 Jul 1804 – 20 Mar 1889) aged 84
Election declared void 30 Jul 1842
17 Aug 1842 – John Neilson Gladstone 18 Jan 1807 7 Feb 1863 56 Sackville Walter Lane-Fox (24 Mar 1797 – 18 Aug 1877) aged 80
30 Jul 1847 – John Chevallier Cobbold 24 Aug 1797 6 Oct 1882 85 Sir Hugh Edward Adair, later [1886] 3rd baronet (to 1874) (26 Dec 1815 – 2 Mar 1902) aged 86
20 Nov 1868 – Henry Wyndham West (1823 – 25 Nov 1893) aged 70
6 Feb 1874 – John Patteson Cobbold (12 Jul 1831 – 10 Dec 1875) aged 44
6 Feb 1874 – James Redfoord Bulwer (to 1880) (22 May 1820 – 4 Mar 1899) aged 78
1 Jan 1876 – Thomas Clement Cobbold (to 1883) (22 Jul 1833 – 21 Nov 1883) aged 50
2 Apr 1880 – Jesse Collings (to 1886) (2 Dec 1831 – 20 Nov 1920) aged 88
12 Dec 1883 – Henry Wyndham West
[following the 7 Nov 1823 25 Nov 1893 70 general election in Nov 1885, the two sitting members (Collings and West) were unseated on petition 1 Apr 1886]
14 Apr 1886 – Sir Charles Dalrymple,1st baronet (to 1906) (15 Oct 1839 – 20 Jun 1916) aged 76
14 Apr 1886 – Hugo Richard Charteris,styled Lord Elcho, later [1914] 11th Earl of Wemyss [S] (25 Aug 1857 – 12 Jul 1937) aged 79
15 Jul 1895 – Daniel Ford Goddard [kt 1907] (to 1918) (17 Jan 1850 – 6 May 1922) aged 72
12 Jan 1906 – Felix Thornley Cobbold (8 Sep 1841 – 6 Dec 1909) aged 68
15 Jan 1910 – Charles Silvester Horne (15 Apr 1865 – 2 May 1914) aged 49
23 May 1914 – Francis John Childs Ganzoni, later [1929] 1st baronet and [1938] 1st Baron Belstead (to 1923) (19 Jan 1882 – 15 Aug 1958) aged 76
REPRESENTATION REDUCED TO ONE MEMBER 1918
6 Dec 1923 – Robert Frederick Jackson (28 May 1880 – 28 Jan 1951) aged 70
29 Oct 1924 – Francis John Childs Ganzoni,later [1929] 1st baronet and [1938] 1st Baron Belstead (to 1938) (19 Jan 1882 – 15 Aug 1958) aged 76
16 Feb 1938 – Richard Rapier Stokes (27 Jan 1897 – 3 Aug 1957) aged 60
24 Oct 1957 – Dingle Mackintosh Foot [kt 1964] (24 Aug 1905 – 18 Jun 1978) aged 72
18 Jun 1970 – Ernle David Drummond Money (17 Feb 1931 – 14 Apr 2013) aged 82
10 Oct 1974 – Kenneth Thomas Weetch (17 Sep 1933 – )
11 Jun 1987 – Michael Fraser Irvine (21 Oct 1939 – )
9 Apr 1992 – James Charles Cann (28 Jun 1946 – 15 Oct 2001) aged 55
22 Nov 2001 – Christopher David Mole (16 Mar 1958 – )
6 May 2010 – Benedict Michael Gummer (19 Feb 1978 – )
8 Jun 2017 – Sandy Martin (2 May 1957 – )
12 Dec 2019 – Tom Hunt (31 Aug 1988 – )